Dear list,
Does anyone know of any analyses that explain the differences in the RETSPLs for different transducers obtained with ear simulators (rather than just standard couplers)? If we assume a person’s hearing threshold is determined by the SPL
at the eardrum roughly independent of tranducer and further assume that an ear simulator achieves a transfer impedance close to that of the average adult ear, then we would expect these RETSPLs to be very similar (and equal to measurements of the minimum audible
pressure under headphones).
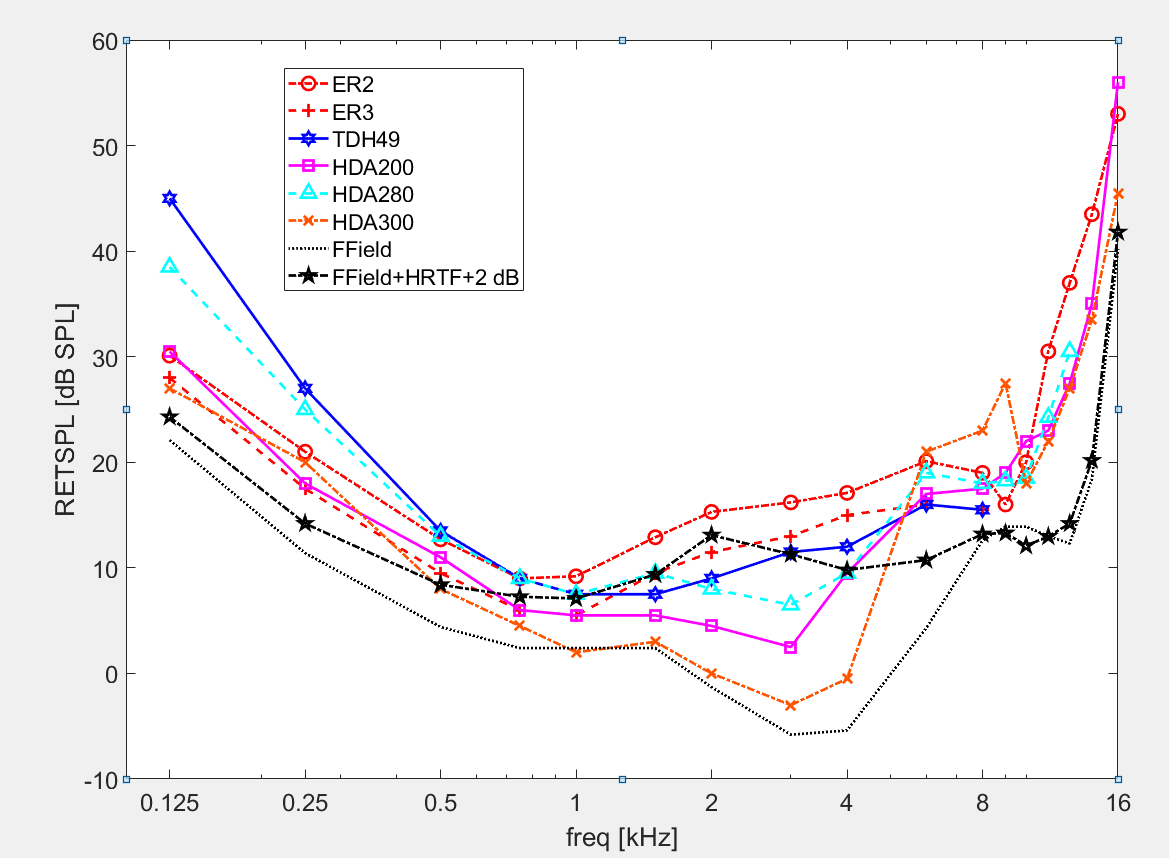
The attached figure shows the RETSPLs for six transducers measured with three ear simulators: the IEC318-4 (was IEC711) for insert phones, the IEC318-1 for TDH49 supra-aurals, and the IEC318-1 with flat plate for the circumaurals (HDA200,250,300).
The figure below show a large differences between RETSPLs (around 20 dB) at 125 Hz and 3 kHz. (Also shown for comparison is the freefield RTSPL measured at the head location plus the head-related transfer function to give the eardrum SPL plus a 2 dB correction
for binaural listening; see e.g. Brian Moore, Intro to Psychology of Hearing for explanation).
Explanations for these differences that I’m aware of or seem plausible are these:
1. Detection thresholds are not just determined by the SPL at the eardrum, but are affected by physiological noise which depends to some extent on the ear canal termination of different headphones (hence violating the first assumption above).
2. The acoustic transfer impedance of the ear simulators differ systematically from that of the notional target population (hence violating the second assumption above).
3. Possibly effect of the point acoustic impedance which may differ between the average real ear and the ear simulator.
4. Sampling errors in determining the RETSPLs.
I wondered if there other factors that I haven’t thought of, and is there any analysis quantifying these different factors (and their frequency dependence)?
Thanks
Ben
Ben Lineton
University of Southampton