Dear List,We are presently working on a study involving perceptual effects of stimulation in the inferior colliculus. We'd like to do some back-of-the-envelope calculations regarding how much of the IC is activated electrically vs. acoustically in comparison to the same values for the auditory nerve/cochlear implants.
Critical to this estimate is to know the point image of activity in the auditory nerve in response to pure tones at a medium level (e.g. 55 dB) . Can anyone direct us to a reference showing the number or percent of auditory nerve fibers responding as a function of tone frequency, for a fixed intensity in this general range? Mammals preferred. Same data for inner hair cells would also be informative.
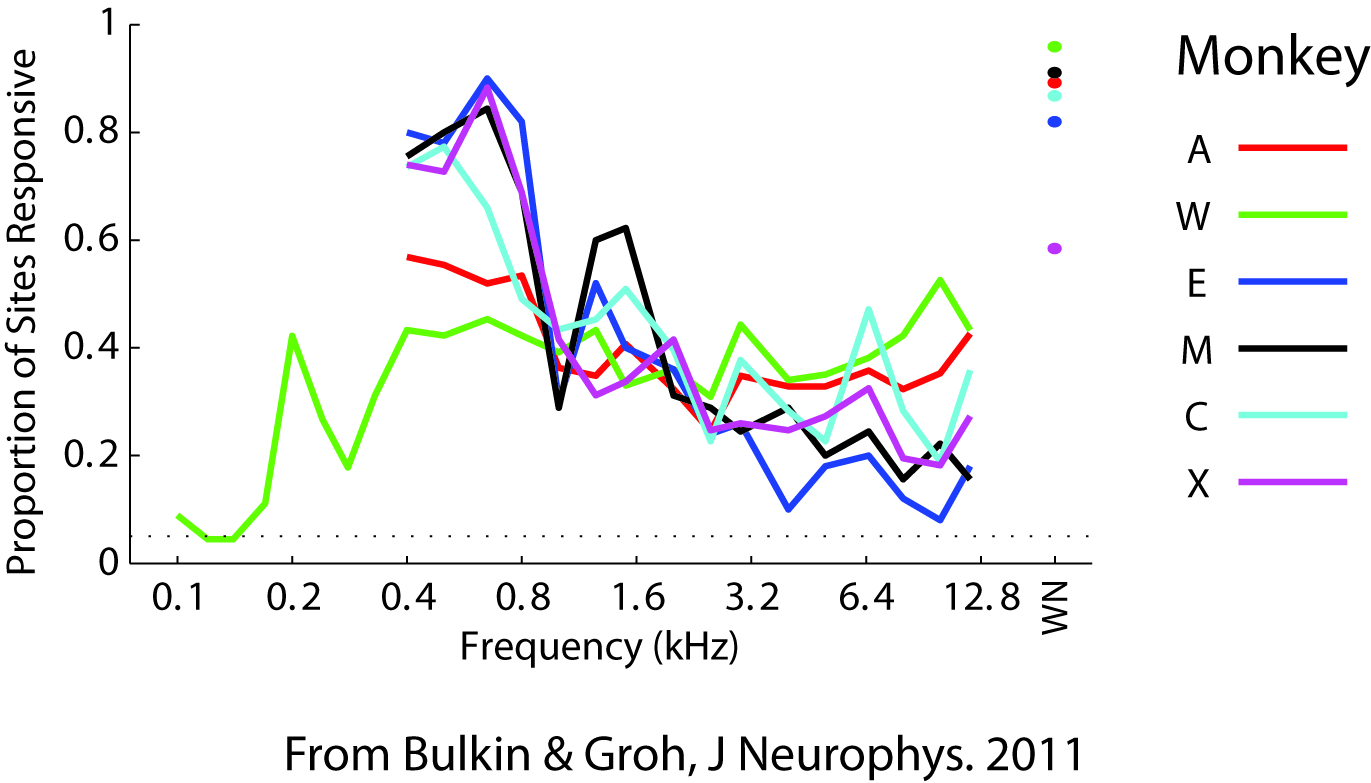
I don't know if enclosures will go through to the list but I'm including here the kind of figure we're looking for: our graph of % of mulitunit sites responding as a function of pure tone frequency in the monkey IC. Between 400 Hz and 3200 Hz, a minimum of 30-40% of the sites responded to each tested frequency in each animal we tested. Bottom panel of Figure 6 in Bulkin and Groh J Neurophys 2011: http://www.ncbi.nlm.nih.gov/pubmed/21307328 or http://people.duke.edu/~jmgroh/Bulkin_Groh_JNP_2011_with_supplement.pdf
Thanks very much!

Best wishes,
--Jennifer Groh

--
Jennifer M. Groh, Ph.D.

Professor
Department of Psychology and Neuroscience
Department of Neurobiology
Center for Cognitive Neuroscience


B203 LSRC, Box 90999
Durham, NC 27708

919-681-6536
www.duke.edu/~jmgroh
Attachment:
pointimage.jpg
Description: JPEG image